Samsung UN65TU7000 TV Review for gamers: input lag from 480i to 4kp60
Summary: This 4k TV (3840x2160) has very low lag but makes up for it with long response times, making the overall speed just ok.
Image quality?
This is a capsule review since the unit I tested had a significant crack, lowering my acquisition cost to zero but preventing any in depth tests of image quality. I did check the upscaling performance on 480i content and was very unimpressed; everything was very blurry and there seemed to be some kind of post processing filter applied to smooth the edges and curves with an effect much like 2xSaI. Heavy blur plus post-processing is a bad combo; though I'd be happy enough if these were toggleable options. They are not, however; indeed there seem to be almost no picture processing options (and what there are, are disabled in gaming mode).
Input Lag
I used a piLagTesterPRO to measure input lag. This device sends a frame of video over HDMI and measures how long it takes to display it.
All tests were in game mode. For progressive content the input lag and response time was the same across all resolutions, from 4k, to 480p. The brightness level, however, had a noticeable effect on apparent lag. For higher brightness levels (around 50 and above), the display is illuminated constantly. With this configuration a displayed image starts to appear at the top of the screen around 6ms after it is sent to the TV over HDMI (aka input lag). But that image takes a full 15ms to reach full brightness (aka response time), which more than undoes any perceptual advantage from the low input lag.
The numbers are rather different when the brightness level is lower; in order to reduce the brightness the TV strobes the backlight to reduce the total light and in doing so they cleverly time the dark part to coincide with the start of the input lag, thus hiding the slow change. Now input lag is roughly 10ms (at the top of the screen) but after just 3 additional MS the brightness level is maybe 70% of the way to full brightness. While this this is a little below the standard I use for measuring response time (I usually use 80% of full brightness) it's close enough perceptually, and the result is a much clearer moving image. Of course the TV is rather dark at this point, so using it in this mode is best for dark rooms. As a bonus, the TV's backlights will last longer with the brightness turned down.
Of course this is all measured at the top of a screen. At 60hz it should take about 16ms for the image to be drawn all the way to the bottom of the screen, if the TV draws at the rate pixels are received. However, lag is only about 14ms longer at the bottom of the screen than the top, suggesting that the input is buffered some and then when drawing commences it goes somewhat faster to catch up, but the effect is small. The TV does accept signals at up to 75hz (depending on the resolution) but just drops frames, still showing only 60 frames per second, so there's no advantage and definite disadvantage to going above 60hz.
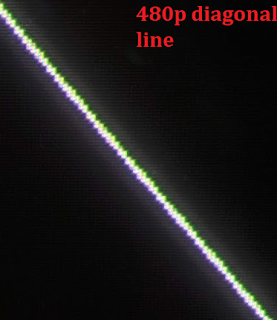
As you might expect the TV is slower for interlaced content, such as 480i: take everything above and add 17ms (yes, slightly more than a frame length). Worryingly, several times when I switched on a 480i input (in game mode!) an additional 16ms was added on top of this (for a total of 33ms for deinterlacing). I found that toggling game mode on and off would return it to the "faster" 17ms, and when I tried to reproduce the problem I could not, suggesting it might have to do with the first time a new device outputs a new resolution, but that's entirely a guess based on too little data.
Full input lag results
I report two kinds of values. 1st response measures how long it takes for the TV to start responding (I use a 5% change in display brightness). This overly optimistic value doesn't tell how long it takes to see anything useful, but matches what other reviewers call input lag. full response is a more realistic measure of lag, and requires the display to reach 80% of full brightness. This combines both input lag and response time, and is closer to what you would actually experience in a game. I'm using the values from full brightness when the TV isn't strobing here, and I'm assuming the variable 480i result was just a configuration glitch that wouldn't be seen once everything was set up properly.
Results compared to other displays
To allow quick comparison between many displays I've summarized the results across all the displays I've personally tested with the piLagTester Pro. Min lag is the time to the first response, measured where the screen starts drawing (typically, the top); real lag is the time to the full response, measured where drawing finishes (usually the screen bottom), i.e. input lag + scan out + response time. Numbers in red denote average values that can vary by up to 8ms between power cycles.
| Display | Year made (TV?) | Native Res | native min lag | native real lag | 480i real lag | 480p real lag | 720p real lag | 1080p real lag | native response time | native scan out |
| Vizio VO370M | 2010 | 1080p | 2.5 | 23.6 | 83.0 | 49.0 | 47.0 | 24.3 | 5.47 | 15.67 |
| TCL 40S325 | 2021 | 1080p | 6.5 | 27.3 | 60.6 | 29.0 | 27.9 | 27.7 | 6.00 | 14.83 |
| TCL 49s403 | 2018 | 4k | 6.1 | 30.2 | 76.8 | 30.9 | 30.3 | 30.7 | 8.00 | 16.13 |
| Panasonic TH-58PE75U | 2008 | 720p | 28.0 | 34.0 | 34.0 | 34.0 | 34.0 | 34.0 | 6.00 | 0.00 |
| Panasonic TH-42PX75U | 2008 | 720p | 28.0 | 34.0 | 34.0 | 34.0 | 34.0 | 34.0 | 6.00 | 0.00 |
| Panasonic TH-50PZ80U | 2008 | 720p | 28.0 | 34.0 | 34.0 | 34.0 | 34.0 | 34.0 | 6.00 | 0.00 |
| Corprit D157 (hdmi) | 2021 | 1080p | 3.1 | 34.5 | 34.9 | 34.8 | 34.6 | 33.9 | 16.25 | 15.13 |
| Samsung UN65TU7000 | 2021 | 4k | 6.0 | 35.0 | 52.0 | 35.0 | 35.0 | 35.0 | 15.00 | 14.00 |
| Samsung S27C230 | 2014 | 1080p | 2.9 | 36.0 | 36.6 | 36.1 | 36.1 | 18.10 | 14.97 | |
| Vizio E470VL (vga) | 2011 | 1080p | 22.0 | 39.0 | 39.0 | 39.0 | 39.0 | 9.00 | 8.00 | |
| Samsung LN32D403 | 2012 | 720p | 20.9 | 41.2 | 58.9 | 42.4 | 40.7 | 40.7 | 5.50 | 14.83 |
| TCL50s423 | 2021 | 4k | 14.0 | 42.0 | 75.0 | 42.0 | 42.0 | 42.0 | 13.00 | 15.00 |
| Dell U2410 (sRGB) | 2010 | 1080p | 20.5 | 42.8 | 62.4 | 45.0 | 43.1 | 43.1 | 6.13 | 16.13 |
| ACER AT3265 | 2012 | 1080p | 19.5 | 43.8 | 62.7 | 45.3 | 43.8 | 43.8 | 8.00 | 16.27 |
| sony XBR 43X800D | 2017 | 4k | 24.5 | 44.3 | 46.5 | 46.0 | 44.6 | 44.7 | 5.00 | 14.83 |
| Element elst5016s | 2017 | 1080p | 21.4 | 45.1 | 63.5 | 46.4 | 45.1 | 45.3 | 8.00 | 15.73 |
| Sony 32L5000 | 2010 | 720p | 21.1 | 45.7 | 80.1 | 47.3 | 46.1 | 45.6 | 9.00 | 15.63 |
| RCA L40FHD41 | 2010 | 1080p | 20.3 | 46.6 | 65.0 | 48.0 | 47.0 | 46.0 | 9.68 | 16.63 |
| Sony 40VL130 (game) | 2008 | 1080p | 22.8 | 47.3 | 66.3 | 49.0 | 47.3 | 47.3 | 9.08 | 15.43 |
| Polaroid FLM-373B | 2007 | 720p | 28.0 | 49.0 | 82.0 | 49.0 | 49.0 | 49.0 | 7.00 | 14.00 |
| Philips 42PFL3603D/F7 | 2009 | 1080p | 29.0 | 50.0 | 84.0 | 50.0 | 50.0 | 50.0 | 5.00 | 16.00 |
| Sony KDL-40V3000 | 2008 | 1080p | 22.2 | 50.1 | 68.4 | 50.6 | 50.5 | 49.8 | 11.00 | 16.93 |
| LG 42LC2D | 2006 | 720p | 28.3 | 50.6 | 54.6 | 50.8 | 50.4 | 6.30 | 15.95 | |
| GPX TDE3245W | 2016 | 720p | 28.0 | 51.0 | 102.0 | 51.0 | 51.0 | 51.0 | 8.00 | 15.00 |
| Sony KDL-46EX400 | 2010 | 1080p | 28.0 | 52.0 | 87.0 | 52.0 | 52.0 | 52.0 | 8.00 | 16.00 |
| Toshiba 40L2200U | 2014 | 1080p | 30.0 | 56.0 | 74.0 | 56.0 | 56.0 | 56.0 | 10.00 | 16.00 |
| Vizio E261VA | 2012 | 720p | 19.3 | 59.0 | 61.1 | 60.4 | 59.2 | 58.9 | 25.00 | 14.67 |
| LG 32DL655H | 2012 | 720p | 35.0 | 59.0 | 105.8 | 59.0 | 59.0 | 59.0 | 9.00 | 15.00 |
| Emprex HD 3202 | 2007 | 720p | 27.0 | 66.0 | 126.0 | 51.0 | 50.0 | 62.0 | 24.00 | 15.00 |
| Samsung LN32B360 | 2010 | 720p | 37.6 | 60.0 | 62.1 | 61.8 | 60.5 | 60.1 | 8.00 | 14.40 |
| Vizio VO22L FHDTV10A | 2008 | 720p | 28.0 | 61.0 | 94.0 | 61.0 | 61.0 | 61.0 | 18.00 | 15.00 |
| Vizio E261VA | 2007 | 720p | 28.0 | 62.0 | 95.0 | 62.0 | 62.0 | 62.0 | 18.00 | 16.00 |
| Samsung P2570HD | 2010 | 1080p | 37.0 | 62.0 | 62.0 | 62.0 | 62.0 | 62.0 | 10.00 | 15.00 |
| Sharp LC-C3234U | 2009 | 720p | 33.0 | 64.6 | 83.6 | 66.6 | 64.6 | 15.00 | 16.60 | |
| Samsung LN46B610 | 2012 | 1080p | 53.0 | 66.0 | 82.0 | 66.0 | 66.0 | 66.0 | 5.00 | 8.00 |
| LG 42PT350 | 2012 | 1080p | 63.5 | 67.7 | 85.9 | 68.9 | 67.7 | 67.7 | 4.20 | 0.00 |
| Mitsubishi LT-46144 | 2008 | 1080p | 51.0 | 68.0 | 75.0 | 68.0 | 68.0 | 68.0 | 9.00 | 8.00 |
| Toshiba 46L5200U | 2013 | 1080p | 55.0 | 71.0 | 89.0 | 76.0 | 71.0 | 74.0 | 8.00 | 8.00 |
| Sony 40S20L1 | 2007 | 720p | 48.4 | 72.0 | 90.1 | 72.9 | 73.4 | 9.60 | 14.00 | |
| Samsung LN46C630 | 2012 | 1080p | 54.5 | 72.1 | 90.7 | 90.3 | 88.5 | 72.3 | 10.00 | 7.63 |
| SANYO DP50749 | 2010 | 720p | 67.0 | 75.0 | 103.0 | 94.0 | 79.0 | 75.0 | 7.00 | 1.00 |
| Samsung HP-T4254 | 2011 | 1080p | 69.7 | 75.7 | 94.1 | 76.0 | 75.7 | 5.00 | 1.00 | |
| LG 47LW6500-UA | 2012 | 1080p | 66.6 | 80.7 | 149.7 | 149.0 | 81.7 | 80.9 | 2.27 | 11.83 |
| Vizio E470VL (hdmi) | 2011 | 1080p | 69.0 | 86.0 | 128.0 | 95.0 | 95.0 | 86.0 | 9.00 | 8.00 |
| Vizio xvt4735v | 2011 | 1080p | 67.6 | 88.6 | 88.8 | 89.2 | 88.6 | 88.6 | 9.00 | 12.00 |
This list is sorted by real lag for each display's native resolution and max refresh rate (usually 1080p60 but some sets are 720p60, and other monitors support > 60hz). This is important - if you sorted instead by input lag alone, this would be nearly the fastest TV I've ever tested. But when response time is included, it's merely average for a 4k/high end TV. That's why you have to test both input lag and response time.
Other sizes, same speeds?
This TV comes in a ton of sizes, from the 43" UN43TU7000FXZA to the really obscenely large 85" UN85TU7000FXZA:
| Size | US Model |
| 43" | UN43TU7000FXZA |
| 50" | UN50TU7000FXZA |
| 55" | UN55TU7000FXZA |
| 58" | UN58TU7000FXZA |
| 60" | UN60TU7000FXZA |
| 65" | UN65TU7000FXZA |
| 70" | UN70TU7000FXZA |
| 75" | UN75TU7000FXZA |
| 82" | UN82TU7000FXZA |
| 85" | UN85TU7000FXZA |
I tested the 65" version, which was also larger than I'd ever want to use personally. As to whether the same lag results would be found across all these models, I don't know. RTings tested the 55" UN55TU7000FXZA and got results about 2ms slower than I report here, however their methods are rather different than mine so that's within the level of difference I would expect caused by sensor location, backlight levels, etc, and not actually hardware differences. In fact I'm amazed we agree as well as we do, given the flickering backlight on this model, which can cause the estimated lag to differ by as much as 5ms between frames depending on where the dark section falls with respect to the drawing of a new input.
Comments