Samsung LN32B360 review: input lag, deinterlacing and upscaling using the piLagTesterPRO
This 720p TV from 2010 looks good at 480i/p and does a great job of deinterlacing. It's 720p performance meanwhile is pretty mediocre, with very high lag, so this is really a TV for retro gamers who can't store (or find) a CRT.
Image quality
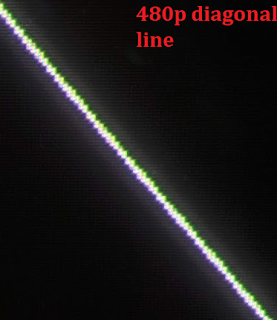
Good upscaling is critical for retro gaming. Ideally, all pixels should appear equally sharp and bright (no aliasing), and angled lines should appear smooth, with no jagged, irregular steps. Also important is that the display shows most or all of the pixels it is sent. Often, this is not the case, with some number of pixels cropped from the bottom or top edges. Shockingly, these tests are relevant for modern gaming as well, because even at their native resolution many TVs have aliasing and cropping.
I attempted to adjust the set to minimize cropping and aliasing; the results below are for the best mode I could find for each.
| resolution | aliasing | cropping (side, top) |
| 480p/i | almost none | about 20 off each side |
| 720p | mild, but visible, even though this is the "native" resolution of the screen! | none if you choose "screen fit". |
1080p is supported and looks ok. It is of course down sampled to fit 720p.
The actual native resolution according to the manual is 1360 x 768. The monitor does not report supporting this mode, and if you force it(DMT mode 39), no image is displayed. Who knows the truth? I guess nobody.
The display has 2 HDMI, VGA, and 1 yPbPr input. I only tested HDMI.
Input Lag
I used a piLagTesterPRO to measure input lag. This device sends a frame of video over HDMI and measures how long it takes to display it. This display has a game mode, but toggling it made no difference, despite the help text on the screen "helpfully" telling me that game mode would speed things up (what scuzzy salesmanship). I toggled all the other display quality settings as well, but did not see any improvements, however the tests reported below are with every "enhancement" set to off.
Input Lag Test Results
I report two kinds of values. 1st response measures how long it takes for the TV to start responding (I use a 5% change in display brightness). This overly optimistic value doesn't tell how long it takes to see anything useful, but matches what other reviewers call input lag. full response is a more realistic measure of lag, and requires the display to reach 80% of full brightness. This combines both input lag and response time, and is closer to what you would actually experience in a game.
One odd and disappointing design choice is that this TV draws from the bottom of the screen up. Thus the first pixels painted on each frame are the bottom row. This seems like a REALLY dumb choice; since the HDMI signal is sent from top to bottom this means the TV can't possibly start processing the next frame until the entire thing is sent to the TV, implying an extra 16ms of lag. And indeed this TV has lots of lag. At least when it starts drawing it actually scans out slightly faster than the refresh rate, taking only about 14.5ms.
Interestingly, though, it's 480i performance is actually decent, in that it's only 2ms slower than 480p. That's not due to using bob deinterlacing, either. I suppose with all that display lag to work with they had time to fit in deinterlacing when needed.
The response time is actually pretty decent too, about 8ms. I didn't see any real motion blur.
This TV does not support 960p so OSSC users are out of luck.
Results compared to other displays & conclusion
To allow quick comparison between many displays I've summarized the results
across all the displays I've personally tested with the piLagTester Pro. Min
lag is the time to the first response, measured where the screen starts
drawing (typically, the top, but for this TV the bottom); real lag is the time to the full response,
measured where drawing finishes (usually the screen bottom, here it's the top), i.e. input lag +
scan out + response time. Numbers in red denote average values that can vary by
up to 8ms between power cycles.
Since this TV has pretty high lag, it would be in the bottom 3rd of my list if sorted by native lag. But since it's 480i performance is so good, I decided to sort by that instead:
By 480i real lag, this TV is actually in the upper 3rd of my collection, and while it's half as fast as the very best performer, it's still way better than most sets. And, it does a good job of deinterlacing, too. Some of those sets achieve high performance by using bob deinterlacing and introducing a lot of flicker, which doesn't happen here. For moderate action/adventure games this would actually be a decent choice, and an excellent choice for RPGs.
Other models (same performance?)
I tested the LN32B360C5D, which is the 32" version. The manual says it is part of "series 3, 360" . Based similarities in their names and shared manual, I suspect that the LN32B360 and LN26B360 would perform similarly. However, I've made no efforts to check if their specs exactly match each other. Although the model numbers might suggest the same performance for the LN19B360 and LN22B360 as well, they have an entirely different back panel layout suggesting a different motherboard.
Comments