SAMSUNG S22F350 review: input lag, deinterlacing and upscaling using the piLagTesterPRO
This is a 1080p75 TN monitor from 2020. It does not have an adjustable stand; the default height and angle are fixed. It does offer a VESA mount if you need more flexibility. Power is supplied via an external 14w DC supply. Like most TN monitors it has little lag, but it does suffer from somewhat high response time.
Image quality and upscaling
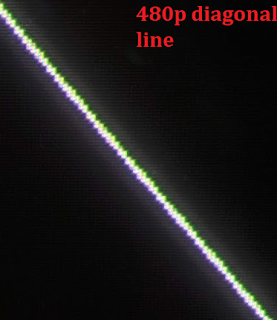
Good upscaling is critical for retro gaming. Ideally, all pixels should appear equally sharp and bright (no aliasing), and angled lines should appear smooth, with no jagged, irregular steps. On computer monitors this is less of an issue than TVs, but it's still worth testing.
| resolution | quality |
| 480p/i | A+ Minimal but detectable blur. Could only display progressive input, interlaced was not supported. |
| 720p | A- Sharp, almost as good as 1080p. Some very slight jaggedness and pixel re-arranging that only really shows up on diagonal lines and 1-pixel wide checkerboards. |
| 1080p | 100% of pixels displayed, all sharp |
Unfortunately this is a TN display which means limited viewing angles - from above everything is washed out and from below it's all too dark. Side to side is actually pretty uniform, with minimal color shifts.
The display has 1 HDMI and 1 VGA input. I only tested HDMI.
Input Lag
I used a piLagTesterPRO to measure input lag. This device sends a frame of video over HDMI and measures how long it takes to display it. This display has a game mode, and with it off input lag was about 4ms at the top of the screen. Turning game mode on did not change input lag any, but did improve response time. I toggled all the other display quality settings as well, but did not see any further improvements, however the tests reported below with every "enhancement" set to off, except for game mode which was on.
Input Lag Test Results
I report two kinds of values. 1st response measures how long it takes for the TV to start responding (I use a 5% change in display brightness). This overly optimistic value doesn't tell how long it takes to see anything useful, but matches what other reviewers call input lag. full response is a more realistic measure of lag, and requires the display to reach 80% of full brightness. This combines both input lag and response time, and is closer to what you would actually experience in a game.
| top | bottom | |||||
| Resolution | 1st (average) | full response | 1st response | full response | scan out | |
| 480i | 4.4 | 14.4 | 19.3 | 29.3 | 14.9 | |
| 480p | 4.4 | 14.4 | 19.3 | 29.3 | 14.9 | |
| 720p | 3.6 | 13.6 | 19.3 | 29.3 | 15.7 | |
| 1080p60 | 3.6 | 13.6 | 19.2 | 29.2 | 15.6 | |
| 1080p75 | 3.4 | 13.4 | 16.2 | 26.2 | 12.8 | |
The input lag is about 4ms across all resolutions and refreshrates. Scan out is about 15ms for 60hz, and about 13ms for 75hz.
Interestingly, the display supports refresh rates above the recommended 60hz, even at 1080p. This is with proper sync: that is to say the monitor doesn't drop frames, but actually increases the redraw rate to keep up with the rate that data is sent to it. If you "overclock" the display it can handle 75hz at 1080p; this is really a misapplication of the term overclocking; what I really mean is if you force your videocard to output 1080p75, the screen will sync with it just fine. You can also go slower, down to 50hz.
One issue is the response time is quite variable depending on the transition the LCD has to make. Black to white is fast (5ms) and fairly clean, whereas other transitions often happen in 2-steps, where the LCD gets close to the desired brightness, pauses for half a frame, and then steps the rest of the way. This made the typical response time 15ms in normal mode, and 10ms in game mode. I'm sure this two-step process causes some motion artifacts when viewed on a high speed camera, and probably results in moving stimuli looking more muddy to the human eye than they would otherwise, so my chart uses the slower 10ms transistions rather than the 5ms from the fastest. I'm not going to be too hard on the display, however, as this is a common issue.
Results compared to other displays
To allow quick comparison between many displays I've summarized the results
across all the displays I've personally tested with the piLagTester Pro. Min
lag is the time to the first response, measured where the screen starts
drawing (typically, the top); real lag is the time to the full response,
measured where drawing finishes (usually the screen bottom), i.e. input lag +
scan out + response time. Numbers in red denote average values that can vary by
up to 8ms between power cycles.
This list is sorted by real lag for each display's native resolution and max
refresh rate (usually 1080p60 but some sets are 720p60, and other monitors, like
this one,
support > 60hz). It is a subset of the screens I've tested, mostly monitors,
but a few TVs thrown in for comparison.
| Display | Year made (TV?) | Native Res | native min lag | native real lag | 480i real lag | 480p real lag | 720p real lag | 1080p real lag | native response time | native scan out |
| Dell E198FPb | 2008 | 1024p | 2.7 | 20.4 | 39.0 | 35.0 | 5.00 | 12.70 | ||
| Planar PLN2200 | 2021 | 1080p | 2.4 | 22.6 | 24.1 | 23.3 | 22.9 | 22.8 | 5.00 | 15.17 |
| Samsung 2494sw | 2011 | 1080p | 2.8 | 22.7 | 26.5 | 26.5 | 26.5 | 8.00 | 13.30 | |
| Vizio VO370M | 2010 | 1080p | 2.5 | 23.6 | 83.0 | 49.0 | 47.0 | 24.3 | 5.47 | 15.67 |
| Dell S199WFP | 2009 | 900p | 3.6 | 24.2 | 28.5 | 27.8 | 27.3 | 27.1 | 8.00 | 12.60 |
| Dell E228WFP | 2010 | 1050p | 3.0 | 24.2 | 26.5 | 26.7 | 5.00 | 16.90 | ||
| LG W1953T | 2010 | 768p | 2.6 | 25.6 | 28.7 | 28.7 | 10.00 | 13.00 | ||
| Samsung S22F350 | 2020 | 1080p | 3.6 | 26.2 | 29.3 | 29.3 | 29.2 | 10.00 | 12.80 | |
| Dell U2410 (game) | 2010 | 1080p | 4.0 | 26.2 | 62.2 | 28.3 | 26.5 | 26.5 | 6.00 | 16.20 |
| TCL 40S325 | 2021 | 1080p | 6.5 | 27.3 | 60.6 | 29.0 | 27.9 | 27.7 | 6.00 | 14.83 |
| TCL 49s403 | 2018 | 4k | 6.1 | 30.2 | 76.8 | 30.9 | 30.3 | 30.7 | 8.00 | 16.13 |
| AOC/Envision G19LWK | 2010 | 900p | 3.1 | 31.2 | 39.5 | 38.7 | 38.4 | 37.8 | 15.50 | 12.60 |
| Dell E2211H | 2014 | 1080p | 3.0 | 33.6 | 34.7 | 34.5 | 34.1 | 33.8 | 15.00 | 15.57 |
| Panasonic TH-58PE75U | 2008 | 720p | 28.0 | 34.0 | 34.0 | 34.0 | 34.0 | 34.0 | 6.00 | 0.00 |
| Dell 1907FPc | 2008 | 1024p | 3.0 | 34.0 | 35.9 | 34.8 | 15.00 | 16.00 | ||
| Panasonic TH-42PX75U | 2008 | 720p | 28.0 | 34.0 | 34.0 | 34.0 | 34.0 | 34.0 | 6.00 | 0.00 |
| Panasonic TH-50PZ80U | 2008 | 720p | 28.0 | 34.0 | 34.0 | 34.0 | 34.0 | 34.0 | 6.00 | 0.00 |
| Corprit D157 (hdmi) | 2021 | 1080p | 3.1 | 34.5 | 34.9 | 34.8 | 34.6 | 33.9 | 16.25 | 15.13 |
| Samsung S27C230 | 2014 | 1080p | 2.9 | 36.0 | 36.6 | 36.1 | 36.1 | 18.10 | 14.97 | |
| Vizio E470VL (vga) | 2011 | 1080p | 22.0 | 39.0 | 39.0 | 39.0 | 39.0 | 9.00 | 8.00 | |
| Samsung LN32D403 | 2012 | 720p | 20.9 | 41.2 | 58.9 | 42.4 | 40.7 | 40.7 | 5.50 | 14.83 |
| TCL50s423 | 2021 | 4k | 14.0 | 42.0 | 75.0 | 42.0 | 42.0 | 42.0 | 13.00 | 15.00 |
| Dell U2410 (sRGB) | 2010 | 1080p | 20.5 | 42.8 | 62.4 | 45.0 | 43.1 | 43.1 | 6.13 | 16.13 |
| ACER AT3265 | 2012 | 1080p | 19.5 | 43.8 | 62.7 | 45.3 | 43.8 | 43.8 | 8.00 | 16.27 |
| sony XBR 43X800D | 2017 | 4k | 24.5 | 44.3 | 46.5 | 46.0 | 44.6 | 44.7 | 5.00 | 14.83 |
| Element elst5016s | 2017 | 1080p | 21.4 | 45.1 | 63.5 | 46.4 | 45.1 | 45.3 | 8.00 | 15.73 |
| Sony 32L5000 | 2010 | 720p | 21.1 | 45.7 | 80.1 | 47.3 | 46.1 | 45.6 | 9.00 | 15.63 |
| RCA L40FHD41 | 2010 | 1080p | 20.3 | 46.6 | 65.0 | 48.0 | 47.0 | 46.0 | 9.68 | 16.63 |
| Sony 40VL130 (game) | 2008 | 1080p | 22.8 | 47.3 | 66.3 | 49.0 | 47.3 | 47.3 | 9.08 | 15.43 |
You can see that this display is quite competitive, like all TNs But stepping back for a moment: pretty much every screen on this list has acceptable lag. The difference between starting to respond 2.7ms vs 6ms after receiving the signal is meaningless. What's more meaningful is the response time, where lower values mean less blurry visuals. The spread is larger there, with this display being decidedly average. But certainly good enough.
Conclusion
Like most computer monitors this display is fast, much faster than most TVs. For most gamers it is plenty fast enough. It is kind of small, and the lack of adjustable stand is a real downer. At least it is VESA mountable, making it a good choice for a second monitor. If you like to share your monitor with a 2nd person the poor viewing angles could be a issue.
Other models
I tested the smallest model, the S22F350. There are several more sizes: S24F350, S27F350, and even a huge S32F351. I don't expect them to perform identically to this model as the larger ones have freesync which probably means entirely different electronics. Indeed, the spec sheets do differ significantly. Given the large space of possible model numbers available to them I don't think they should have used the F350 postfix for all these models.
Comments